
THE HOUSING DATA REFERENCE
100 Denver Metro Housing Market Statistics November 2026
Prices, buyer choice, selling time and ownership costs, with Arvada and west metro comparisons. Every observation links to its original source and keeps its reporting period visible.
Reviewed and updated
Start with the question you need to answer: what can you buy, what competes with your listing, or what will ownership cost? A regional headline is a starting point. This reference separates transactions, repeat-sales price indexes, mortgage benchmarks, household estimates and construction authorizations so you can use each measure for its intended purpose.
The sales snapshot covers REcolorado’s September reporting period. Local comparisons cover Arvada, Golden, Wheat Ridge and Westminster. Statewide and national figures are explicitly labeled. For neighborhood and property-level interpretation, see Lisa’s Arvada housing market guide.
Key Takeaways
- All homes: median closed price: $575,000 (September 2026). (REcolorado, October 2026)
- All homes: median price, year-over-year: −2% (September 2026). (REcolorado, October 2026)
- Active listings: 13,522 (September 2026). (REcolorado, October 2026)
- Inventory supply: 20 weeks (September 2026). (REcolorado, October 2026)
- New listings: 4,885 (September 2026). (REcolorado, October 2026)
- Pending listings: 2,921 (September 2026). (REcolorado, October 2026)
- Closed listings: 2,898 (September 2026). (REcolorado, October 2026)
- Closed listings: year-over-year: −18% (September 2026). (REcolorado, October 2026)
- Median days in MLS: 33 days (September 2026). (REcolorado, October 2026)
- 30-year fixed national average: 7.24% (October 29, 2026). (Freddie Mac, October 2026)
- Arvada: Owner-occupied housing rate: 75.3% (2020–2024 ACS). (U.S. Census Bureau, November 2026)
- Colorado: units in 1-unit structures: 17,406 (Calendar year 2025). (U.S. Census Bureau, May 2026)
How are Denver metro home prices changing?
Price headlines need a property type and a time horizon. The sale-price snapshot and repeat-sales indexes below answer different questions, so use them side by side rather than combining them into a valuation.
The regional overview above identifies the latest transaction benchmark used here. The tables below separate attached from detached sales and then compare the direction of repeat-sales indexes across geographies. A sensible reading starts with the homes a buyer could actually choose and the recent transactions a seller would compete against. Use the longer index windows as context for market history, while keeping the current competitive set central to a purchase or listing decision. None of the regional measures substitutes for reviewing the home’s condition, location, features and immediate alternatives.

How do attached and detached sale prices compare?
The property-type medians show why the combined regional figure needs context. Read each segment on its own before using the overall number in a budget or pricing discussion. These transaction measures describe the mix of properties that closed in the specified month. Use the attached and detached rows as a prompt to narrow a search, rather than as a statement that one home category offers better value. For a particular address, compare relevant properties and review differences in condition, size, location and ownership obligations. The prior-year row supplies a seasonal comparison point; the monthly percentage describes a different comparison window.
| Measure | Period | Statistic and source |
|---|---|---|
| All homes: median price, month-over-month | September 2026 | −3% (REcolorado, October 2026) |
| Attached: median closed price | September 2026 | $390,000 (REcolorado, October 2026) |
| Detached: median closed price | September 2026 | $635,000 (REcolorado, October 2026) |
| All homes: prior-year September median | September 2025 | $585,000 (REcolorado, October 2026) |
Do longer-term price indexes tell the same story?
The index rows provide a repeat-sales view with separate quarterly, annual and longer windows. Each percentage belongs to its stated geography and comparison period. All values below use FHFA’s seasonally adjusted, nominal, purchase-only series. Read the annual and quarterly entries independently: a market can have different directions over different windows.
| Measure | Period | Statistic and source |
|---|---|---|
| Denver–Aurora–Centennial: Annual change | Period ended 2026 Q2 | -0.98% (FHFA, August 2026) |
| Denver–Aurora–Centennial: Quarterly change | Period ended 2026 Q2 | -0.05% (FHFA, August 2026) |
| Denver–Aurora–Centennial: Five-year change | Period ended 2026 Q2 | +12.36% (FHFA, August 2026) |
| Denver–Aurora–Centennial: Change since 1991 Q1 | Period ended 2026 Q2 | +608.28% (FHFA, August 2026) |
| Colorado: Annual change | Period ended 2026 Q2 | -0.53% (FHFA, August 2026) |
| Colorado: Quarterly change | Period ended 2026 Q2 | +0.02% (FHFA, August 2026) |
| Colorado: Five-year change | Period ended 2026 Q2 | +15.97% (FHFA, August 2026) |
| Colorado: Change since 1991 Q1 | Period ended 2026 Q2 | +574.35% (FHFA, August 2026) |
How do Colorado Springs and national price indexes compare?
The comparison below uses the same index type and ending quarter. Colorado Springs and the United States provide separate benchmarks; neither substitutes for the Denver statistical area or a local valuation.
| Measure | Period | Statistic and source |
|---|---|---|
| Colorado Springs: Annual change | Period ended 2026 Q2 | -0.71% (FHFA, August 2026) |
| Colorado Springs: Quarterly change | Period ended 2026 Q2 | -0.74% (FHFA, August 2026) |
| Colorado Springs: Five-year change | Period ended 2026 Q2 | +15.04% (FHFA, August 2026) |
| Colorado Springs: Change since 1991 Q1 | Period ended 2026 Q2 | +459.14% (FHFA, August 2026) |
| United States: Annual change | Period ended 2026 Q2 | +2.13% (FHFA, August 2026) |
| United States: Quarterly change | Period ended 2026 Q2 | +0.35% (FHFA, August 2026) |
| United States: Five-year change | Period ended 2026 Q2 | +33.41% (FHFA, August 2026) |
| United States: Change since 1991 Q1 | Period ended 2026 Q2 | +335.69% (FHFA, August 2026) |
How much choice do Denver metro buyers have?
Buyer choice is best examined alongside the flow of listings and contracts. The inventory benchmarks in the takeaways establish the regional snapshot; the tables below unpack the activity around it. Use these measures to decide which questions to ask about your own search. An active listing count describes availability at the reporting point, while new listings describe homes entering the market during the period. Pending and closed listings describe other stages of activity. Compare them within the same report and geography. For a practical home search, narrow the comparison to the property types, locations and price ranges you would consider.

Is the flow of new listings changing?
The year-over-year and prior-month entries supply different reference points for incoming supply. Keep them separate when assessing whether a change looks seasonal or persists across comparable periods.
Start with the new-listing and active-inventory benchmarks in the takeaways, then use these rows as additional context. An increase in overall availability does not identify which homes fit a particular search. Work from your preferred location, property type and complete ownership budget, and evaluate the alternatives that meet those requirements. The figures are useful for framing that review, but a regional supply count alone cannot tell you what terms a seller will accept. For an individual offer, examine the home’s presentation, pricing history and current competition alongside the market context.
| Measure | Period | Statistic and source |
|---|---|---|
| Active listings: year-over-year | September 2026 | +2% (REcolorado, October 2026) |
| New listings: year-over-year | September 2026 | −1% (REcolorado, October 2026) |
| Prior-month new listings | August 2026 | 4,888 (REcolorado, October 2026) |
How does activity differ by property type?
The attached and detached rows separate incoming listings, contracts and completed transactions. Those categories describe different events and should retain their labels when quoted. Use this split to organize a more focused comparison rather than to infer a sale probability from the counts. The transactions in a monthly closed total are not necessarily the properties entering that month’s pending total. Likewise, a new listing is not automatically a direct competitor for every home already available. The useful next step is to examine comparable properties in the relevant segment.
| Measure | Period | Statistic and source |
|---|---|---|
| Pending listings: year-over-year | September 2026 | −13% (REcolorado, October 2026) |
| Attached new listings | September 2026 | 1,475 (REcolorado, October 2026) |
| Detached new listings | September 2026 | 3,410 (REcolorado, October 2026) |
| Attached pending listings | September 2026 | 749 (REcolorado, October 2026) |
| Detached pending listings | September 2026 | 2,172 (REcolorado, October 2026) |
| Attached closed listings | September 2026 | 740 (REcolorado, October 2026) |
| Detached closed listings | September 2026 | 2,158 (REcolorado, October 2026) |
How quickly are Denver metro homes selling?
Selling-time comparisons need both a property type and a calendar reference. The latest median in the takeaways is a regional benchmark; the tables below show the comparison periods behind it.
Use the closed-listing measures to understand the volume completing a transaction, then examine the time measures separately. Neither provides a guaranteed schedule for a particular home. A useful listing discussion asks which properties compete directly, how the home will be presented and what feedback should trigger a review. A useful buying discussion asks how the target home compares with the alternatives available now. These are property-level questions. The regional and seasonal figures help frame them, while keeping the distinction between a typical observation and a promise about the next transaction.

Are completed sales and marketing times moving together?
The volume changes and time changes measure separate aspects of the market. Read each against its own stated baseline rather than expecting them to move together. For sellers, use this distinction to keep a pricing and timing discussion grounded in comparable properties. A broad transaction count does not explain an individual listing’s response. For buyers, use the marketing-time context to prepare questions about pricing, condition and competing choices rather than to assume a particular discount is available. The monthly comparison uses the immediately preceding month; the annual comparison uses the same month a year earlier. Preserve that distinction when sharing the figures.
| Measure | Period | Statistic and source |
|---|---|---|
| Closed listings: month-over-month | September 2026 | −8% (REcolorado, October 2026) |
| Prior-month closed listings | August 2026 | 3,137 (REcolorado, October 2026) |
| Median days: year-over-year change | September 2026 | −4 days (REcolorado, October 2026) |
| Median days: month-over-month change | September 2026 | +4 days (REcolorado, October 2026) |
How much does the seasonal comparison matter?
The historical rows show the timing pattern within the same regional report. The attached and detached observations add a separate property-type comparison for the latest period. Use the monthly sequence to put the latest figure in context, while avoiding a forecast that repeats the prior pattern automatically. The comparison is most useful when its labels travel with the number: period, property type and median days in MLS.
| Measure | Period | Statistic and source |
|---|---|---|
| Attached median days | September 2026 | 47 days (REcolorado, October 2026) |
| Detached median days | September 2026 | 29 days (REcolorado, October 2026) |
| All homes median days | September 2025 | 37 days (REcolorado, October 2026) |
| All homes median days | August 2026 | 29 days (REcolorado, October 2026) |
| All homes median days | January 2026 | 56 days (REcolorado, October 2026) |
| All homes median days | March 2026 | 18 days (REcolorado, October 2026) |
| All homes median days | April 2026 | 15 days (REcolorado, October 2026) |
| All homes median days | May 2026 | 16 days (REcolorado, October 2026) |
| All homes median days | June 2026 | 19 days (REcolorado, October 2026) |
What does buying and owning a home cost?
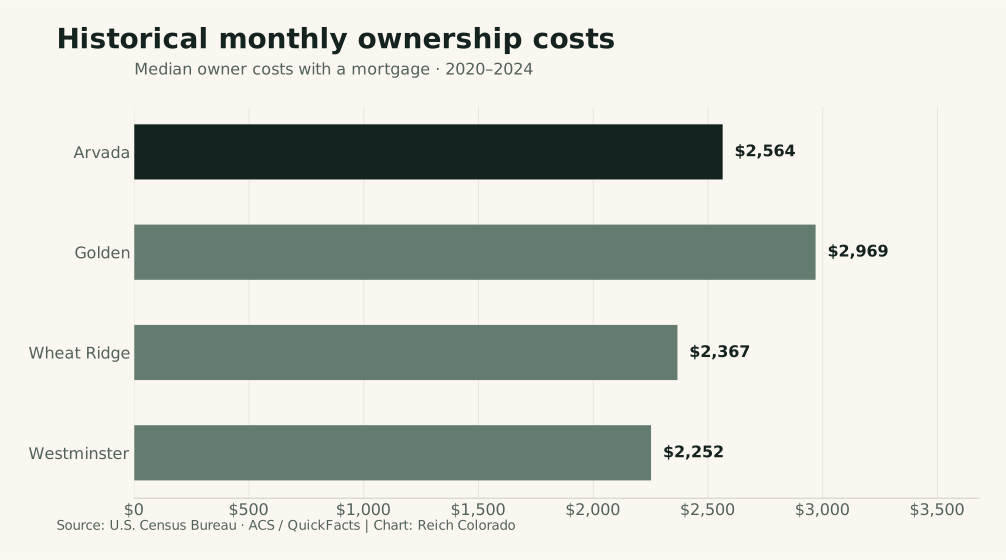
Budget with the cost categories you will actually pay. A mortgage benchmark and a historical household-cost estimate provide useful context, but neither is a personalized purchase quote. This section separates current national financing observations from local Census estimates for established households. Use the rate table to understand the financing reference period, then obtain a quote for the loan you are considering. Use the local ownership and rent rows as historical context for comparing communities. Keep the purchase price, down payment, loan terms, taxes, insurance, association obligations and maintenance assumptions visible in your own worksheet. The goal is a budget you can review and update.
What do national mortgage-rate benchmarks show?
The weekly observations below describe Freddie Mac’s national fixed-rate survey averages. They are benchmarks for their specified weeks, rather than offers for a Colorado borrower. The latest headline benchmark appears in the takeaways and is not repeated here. The remaining rows retain both the loan term and observation date. Compare rates within the same term and use a lender’s quote to evaluate your own financing options. When comparing offers, keep the terms, fees and assumptions together instead of selecting a loan from the headline interest rate alone.
| Measure | Period | Statistic and source |
|---|---|---|
| 15-year fixed national average | October 29, 2026 | 6.60% (Freddie Mac, October 2026) |
| 30-year fixed national average | October 22, 2026 | 7.32% (Freddie Mac, October 2026) |
| 15-year fixed national average | October 22, 2026 | 6.68% (Freddie Mac, October 2026) |
| 30-year fixed national average | October 15, 2026 | 7.40% (Freddie Mac, October 2026) |
| 15-year fixed national average | October 15, 2026 | 6.71% (Freddie Mac, October 2026) |
What were the earlier financing benchmarks?
These earlier weekly observations provide a dated reference for the recent financing environment. Compare loan terms separately, and use a current lender quote for a specific purchase budget.
| Measure | Period | Statistic and source |
|---|---|---|
| 30-year fixed national average | October 1, 2026 | 7.28% (Freddie Mac, October 2026) |
| 15-year fixed national average | October 1, 2026 | 6.60% (Freddie Mac, October 2026) |
| 30-year fixed national average | September 24, 2026 | 7.03% (Freddie Mac, September 2026) |
| 15-year fixed national average | September 24, 2026 | 6.42% (Freddie Mac, September 2026) |
| 30-year fixed national average | September 3, 2026 | 6.71% (Freddie Mac, September 2026) |
| 15-year fixed national average | September 3, 2026 | 6.04% (Freddie Mac, September 2026) |
How do historical ownership costs and rents compare locally?
The local figures below describe the Census estimation window shown in each row. They do not estimate the payment on a home purchased today.
| Measure | Period | Statistic and source |
|---|---|---|
| Arvada: Median gross monthly rent | 2020–2024 ACS | $1,888 (U.S. Census Bureau, November 2026) |
| Arvada: Median monthly owner costs, with mortgage | 2020–2024 ACS | $2,564 (U.S. Census Bureau, November 2026) |
| Golden: Median gross monthly rent | 2020–2024 ACS | $1,953 (U.S. Census Bureau, November 2026) |
| Golden: Median monthly owner costs, with mortgage | 2020–2024 ACS | $2,969 (U.S. Census Bureau, November 2026) |
| Wheat Ridge: Median gross monthly rent | 2020–2024 ACS | $1,579 (U.S. Census Bureau, November 2026) |
| Wheat Ridge: Median monthly owner costs, with mortgage | 2020–2024 ACS | $2,367 (U.S. Census Bureau, November 2026) |
| Westminster: Median gross monthly rent | 2020–2024 ACS | $1,882 (U.S. Census Bureau, November 2026) |
| Westminster: Median monthly owner costs, with mortgage | 2020–2024 ACS | $2,252 (U.S. Census Bureau, November 2026) |
How does Arvada compare with nearby communities?
Consistent definitions make local comparisons more useful. The same Census estimation window lets you compare the selected communities without presenting historical household estimates as current transaction prices.
Use the homeownership and home-value rows to understand broad housing characteristics. The household rows provide a separate view of scale and occupancy. These figures do not rank neighborhoods or establish what an individual home should sell for. A practical comparison starts with the places and property types that suit your needs, then reviews current options within that search. Keep the Census view as background for that process. Arvada’s headline homeownership measure appears in the takeaways, while the remaining comparisons below retain the same definition and period for easy reference.

How do homeownership and historical home values compare?
The tables distinguish owner occupancy from the median value of owner-occupied homes. These are separate measures, each drawn from the same multiyear estimation window. Read the value entries as historical Census estimates rather than asking prices or current sale medians.
| Measure | Period | Statistic and source |
|---|---|---|
| Arvada: Median owner-occupied home value | 2020–2024 ACS | $632,600 (U.S. Census Bureau, November 2026) |
| Golden: Owner-occupied housing rate | 2020–2024 ACS | 56.8% (U.S. Census Bureau, November 2026) |
| Golden: Median owner-occupied home value | 2020–2024 ACS | $837,700 (U.S. Census Bureau, November 2026) |
| Wheat Ridge: Owner-occupied housing rate | 2020–2024 ACS | 54.4% (U.S. Census Bureau, November 2026) |
| Wheat Ridge: Median owner-occupied home value | 2020–2024 ACS | $623,000 (U.S. Census Bureau, November 2026) |
| Westminster: Owner-occupied housing rate | 2020–2024 ACS | 61.9% (U.S. Census Bureau, November 2026) |
| Westminster: Median owner-occupied home value | 2020–2024 ACS | $532,400 (U.S. Census Bureau, November 2026) |
What do household counts add to the comparison?
Household counts describe community scale, while the Arvada occupancy and residential-stability observations describe different characteristics. None is a measure of current listing turnover. Use these rows as background when reading local housing information, and keep the definition attached to each figure. A household count is not a count of homes for sale. The residential-stability measure describes people meeting the stated age definition, rather than the share of properties sold.
| Measure | Period | Statistic and source |
|---|---|---|
| Arvada: Households | 2020–2024 ACS | 49,881 (U.S. Census Bureau, November 2026) |
| Golden: Households | 2020–2024 ACS | 7,780 (U.S. Census Bureau, November 2026) |
| Wheat Ridge: Households | 2020–2024 ACS | 15,030 (U.S. Census Bureau, November 2026) |
| Westminster: Households | 2020–2024 ACS | 48,106 (U.S. Census Bureau, November 2026) |
| Arvada: persons per household | 2020–2024 ACS | 2.44 (U.S. Census Bureau, November 2026) |
| Arvada: residents age 1+ in same home one year earlier | 2020–2024 ACS | 87.0% (U.S. Census Bureau, November 2026) |
How much new housing is being permitted?
A construction authorization is a measure of potential housing supply. Use the permit tables to distinguish structure types and geographies, while keeping completions and available homes as separate questions. The selected annual figures provide a common calendar-year comparison rather than a partial-year snapshot. They count authorized housing units within each structure-size category, not simply the number of permit documents or buildings. This distinction matters when reading a multifamily entry beside a single-unit entry. For a new-home search, use the regional context to frame questions about actual communities, available homes and expected timing. For a resale listing, review the specific builder offerings a buyer could choose instead.

What types of housing did Colorado authorize?
The statewide rows distinguish units authorized in structures of different sizes. The single-unit headline appears in the takeaways; the remaining categories are shown below. Keep the unit definition when quoting the data. A category describing larger structures counts the housing units authorized within those structures, rather than an equal number of buildings. The annual observations also should not be described as homes finished or available for immediate occupancy. For a purchase decision, ask about a specific property’s construction stage, terms and expected delivery. Lisa’s new-construction resource provides a starting point for those questions.
| Measure | Period | Statistic and source |
|---|---|---|
| Colorado: units in 2-unit structures | Calendar year 2025 | 462 (U.S. Census Bureau, May 2026) |
| Colorado: units in 3–4-unit structures | Calendar year 2025 | 240 (U.S. Census Bureau, May 2026) |
| Colorado: units in 5+-unit structures | Calendar year 2025 | 15,646 (U.S. Census Bureau, May 2026) |
How do selected Denver-area counties compare?
The county rows use the same annual survey and authorized-unit definition. They show selected structure-size categories, rather than complete county totals. Read Jefferson, Denver and Douglas as distinct county geographies. Do not assign a county-wide count to Arvada, and do not sum the displayed categories as though every category were included for every county. The table is designed to make selected unit counts easy to verify at their original source.
| Measure | Period | Statistic and source |
|---|---|---|
| Jefferson County: units in 1-unit structures | Calendar year 2025 | 810 (U.S. Census Bureau, May 2026) |
| Jefferson County: units in 2-unit structures | Calendar year 2025 | 24 (U.S. Census Bureau, May 2026) |
| Jefferson County: units in 3–4-unit structures | Calendar year 2025 | 6 (U.S. Census Bureau, May 2026) |
| Jefferson County: units in 5+-unit structures | Calendar year 2025 | 278 (U.S. Census Bureau, May 2026) |
What did Denver and Douglas counties authorize?
These selected categories use the same calendar year and authorized-unit definition as Jefferson County. They describe county geographies and do not measure completed homes or current Arvada inventory.
| Measure | Period | Statistic and source |
|---|---|---|
| Denver County: units in 1-unit structures | Calendar year 2025 | 1,027 (U.S. Census Bureau, May 2026) |
| Denver County: units in 3–4-unit structures | Calendar year 2025 | 12 (U.S. Census Bureau, May 2026) |
| Denver County: units in 5+-unit structures | Calendar year 2025 | 3,688 (U.S. Census Bureau, May 2026) |
| Douglas County: units in 1-unit structures | Calendar year 2025 | 1,465 (U.S. Census Bureau, May 2026) |
| Douglas County: units in 3–4-unit structures | Calendar year 2025 | 46 (U.S. Census Bureau, May 2026) |
| Douglas County: units in 5+-unit structures | Calendar year 2025 | 881 (U.S. Census Bureau, May 2026) |
Methodology and Sources
This reference contains 100 distinct cited observations, including dated historical comparisons, selected from the original producers’ pages and reports. Each observation appears once in the text or tables; figures are separately credited charts. Original URLs and matching data were checked on November 3, 2026. The sales geography is REcolorado’s 11-county Greater Denver Metro area; FHFA’s Denver metro index follows its own statistical-area definition. Census ACS figures cover 2020–2024; their November 2026 citation dates identify access, not publication. Permit figures cover calendar 2025 and were released in May 2026. Mortgage observations retain their exact weekly dates and use the observation month in their citations. Figures use source-reported rounding; charts visualize selected observations and add no observations to the count. No source producer accounts for more than 40% of the cited observations. The editorial plan is a monthly review; the update stamp must advance only after sources and affected statistics have been checked.
Glossary
- ACS: American Community Survey; Census estimates for the stated period.
- MLS: Multiple listing service; the source reporting system for the transaction measures.
- HPI: House Price Index; the specified repeat-sales price series.
- FHFA: Federal Housing Finance Agency, publisher of the cited HPI report.
- PMMS: Freddie Mac’s Primary Mortgage Market Survey.
- HOA: Homeowners association.
- Attached / detached: Property categories used by the cited MLS report.
- Median: The midpoint of the measured distribution.
- Nominal: Expressed without adjusting for inflation.
- Seasonally adjusted: Adjusted by the producer to account for recurring seasonal patterns.
- Authorized housing unit: A housing unit covered by a building authorization; distinct from a completed home.
Sources
- REcolorado: September 2026 Housing Market Reports; published October 7, 2026
- REcolorado: Denver Metro Market Watch, September 2026; released October 7, 2026
- FHFA: House Price Index Quarterly Report, 2026 Q2; August 25, 2026
- Freddie Mac: Primary Mortgage Market Survey archive, 2026; individual observation dates retained
- U.S. Census Bureau: Arvada QuickFacts, 2020–2024 ACS estimates; accessed November 3, 2026
- U.S. Census Bureau: Golden QuickFacts, 2020–2024 ACS estimates; accessed November 3, 2026
- U.S. Census Bureau: Wheat Ridge QuickFacts, 2020–2024 ACS estimates; accessed November 3, 2026
- U.S. Census Bureau: Westminster QuickFacts, 2020–2024 ACS estimates; accessed November 3, 2026
- U.S. Census Bureau: Building Permits Survey final 2025 annual state estimates; released May 14, 2026
- U.S. Census Bureau: Building Permits Survey final 2025 annual county estimates; released May 14, 2026